2025 Apple Health Wrapped
Your Health Data, Finally Visualized.
We turn your Apple Health data into a simple yearly overview. Visualise your activities and share it with the world.
Watch video
How Health Wrapped works

Step 1
Download iOS Mobile App
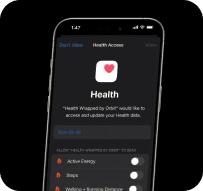
Step 2
Allow access to Apple Health
Step 3
Visualise your health journey
See how you've progressed in 2025.
From body movements to yearly milestones, see it all in one place.
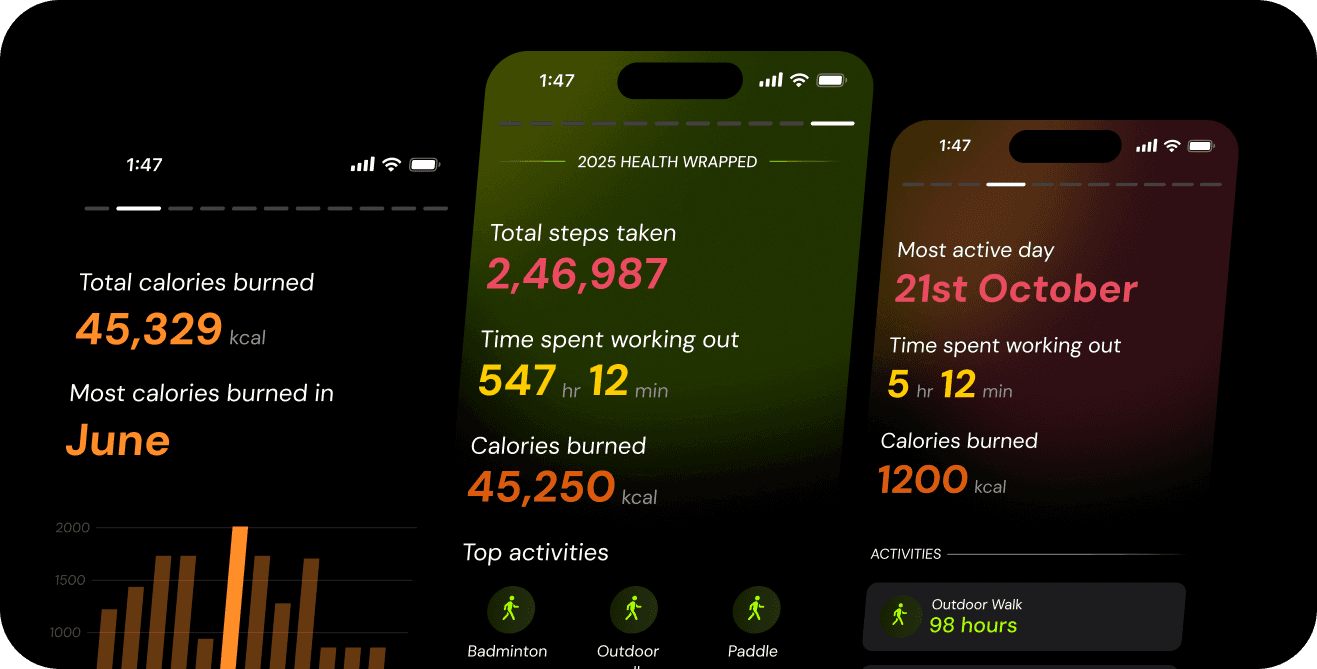
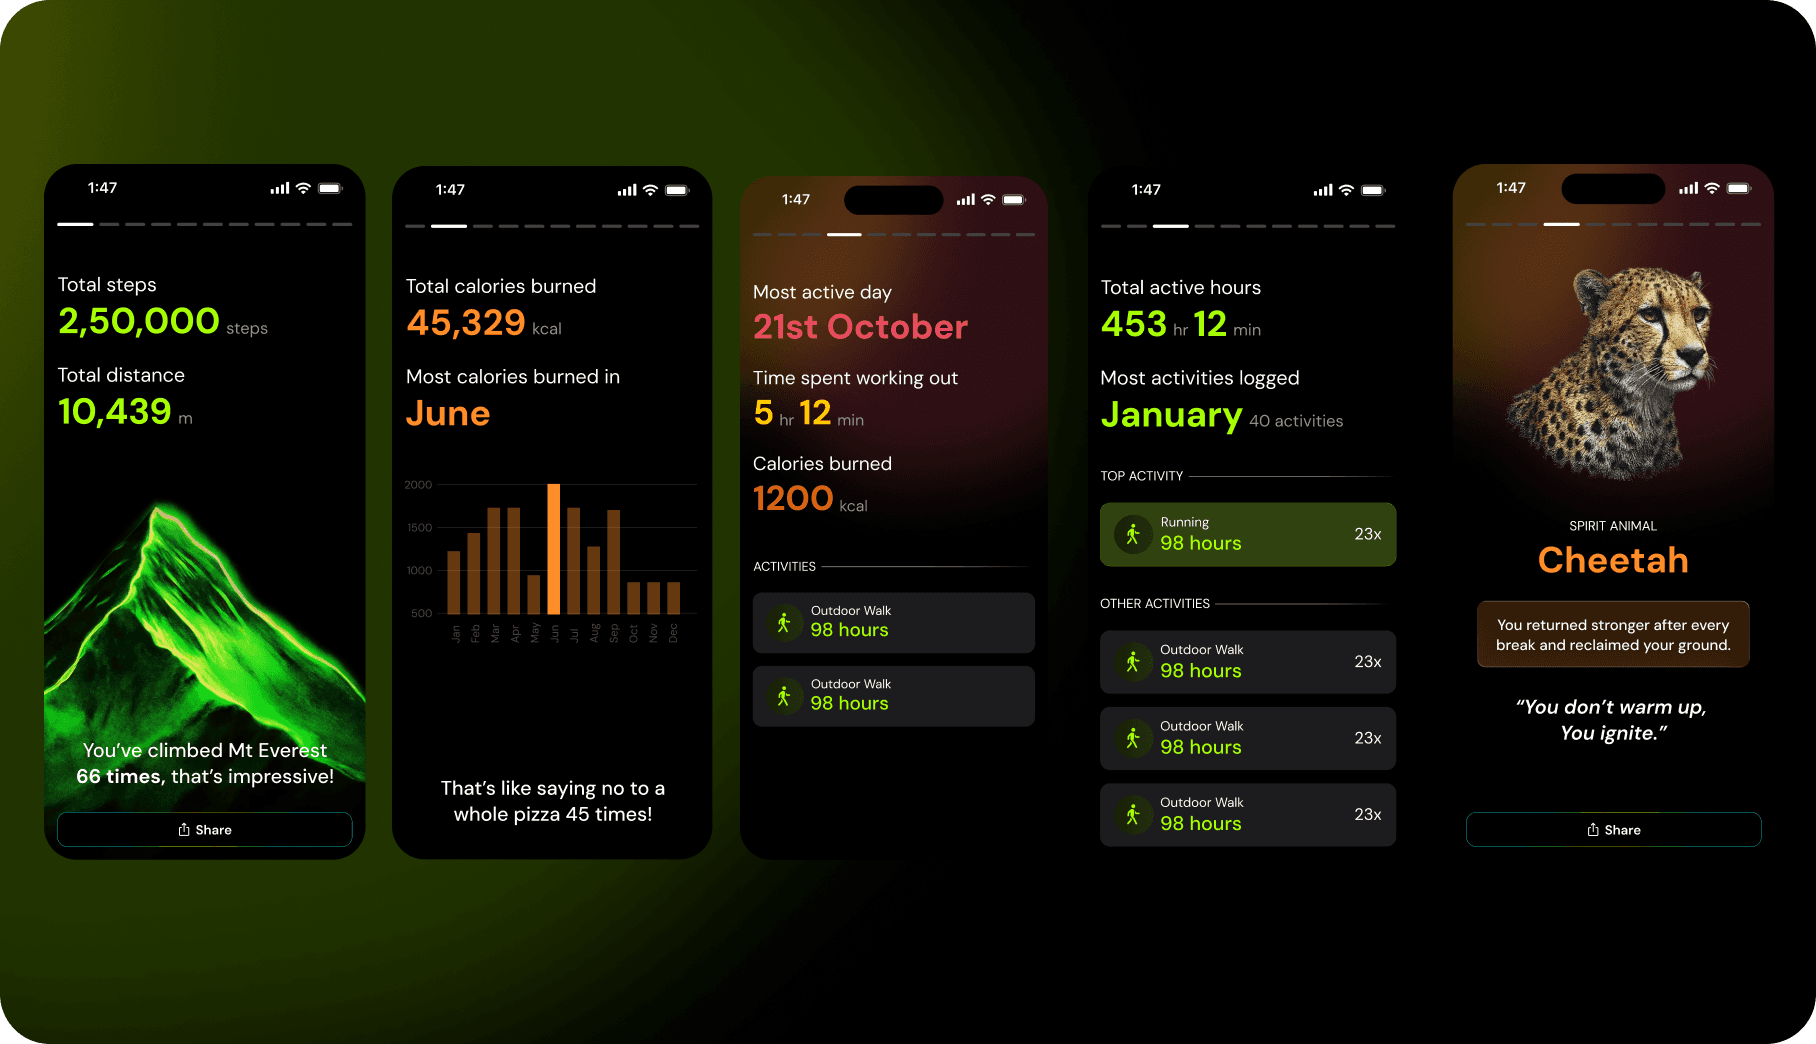
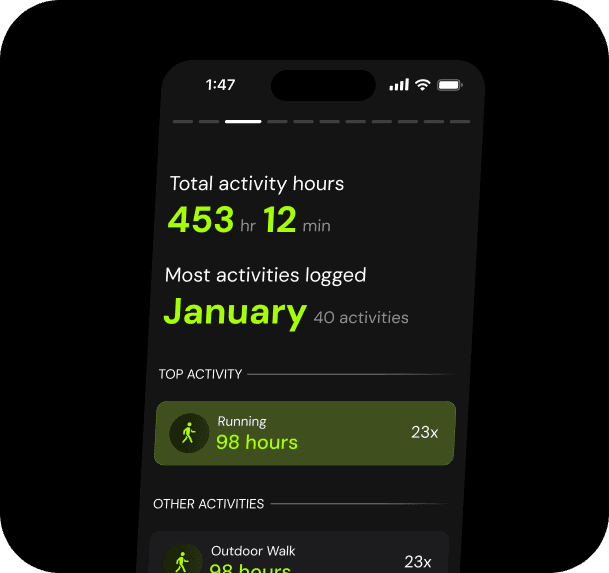
Your Year at a Glance
Your total steps, distance, calories, and active hours — all in one view.
Activity Trends
See how your movement changed month by month across the year.
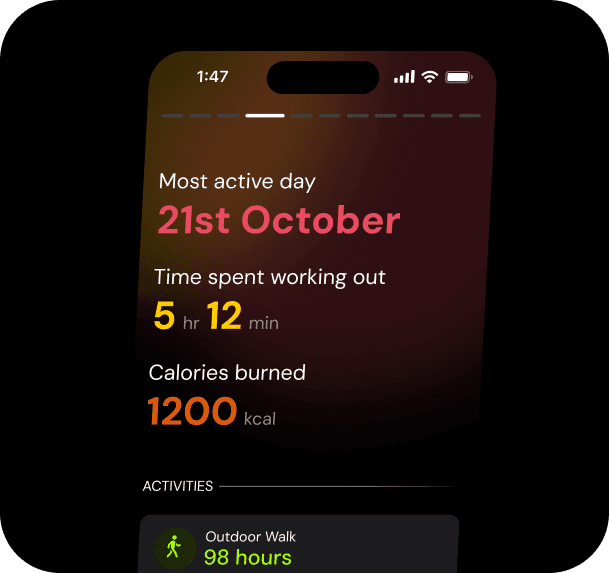
Peak Moments
Discover your most active day and most active month of 2025.
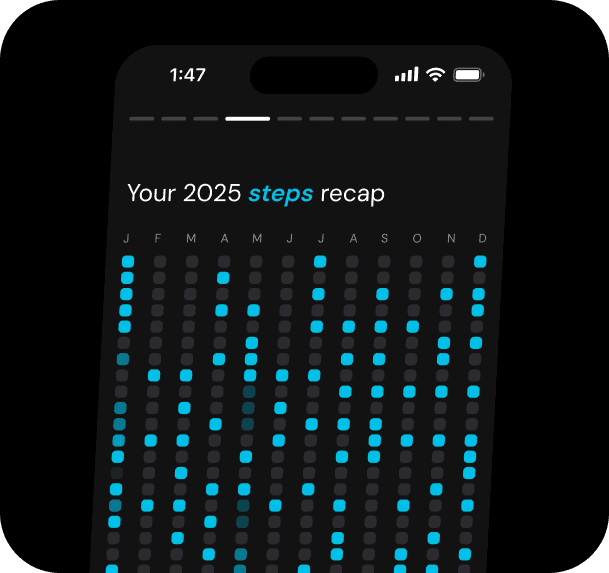
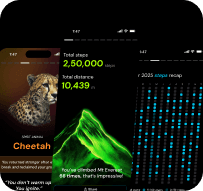
Visual Heatmap
A visual heatmap of every active day across 2025.


Your Fitness Personality
Consistency Streaks
Your longest streaks and most consistent fitness habits.
Experience and share your 2025 Health Wrap!
2025 Apple Health Wrapped
2025 Apple Health Wrapped
Your Health Data, Finally Visualized.
We turn your Apple Health data into a simple yearly overview. Visualise your activities and share it with the world.
Watch video
Watch video
How Health Wrapped works

Step 1
Download iOS Mobile App
Step 1
Download iOS Mobile App
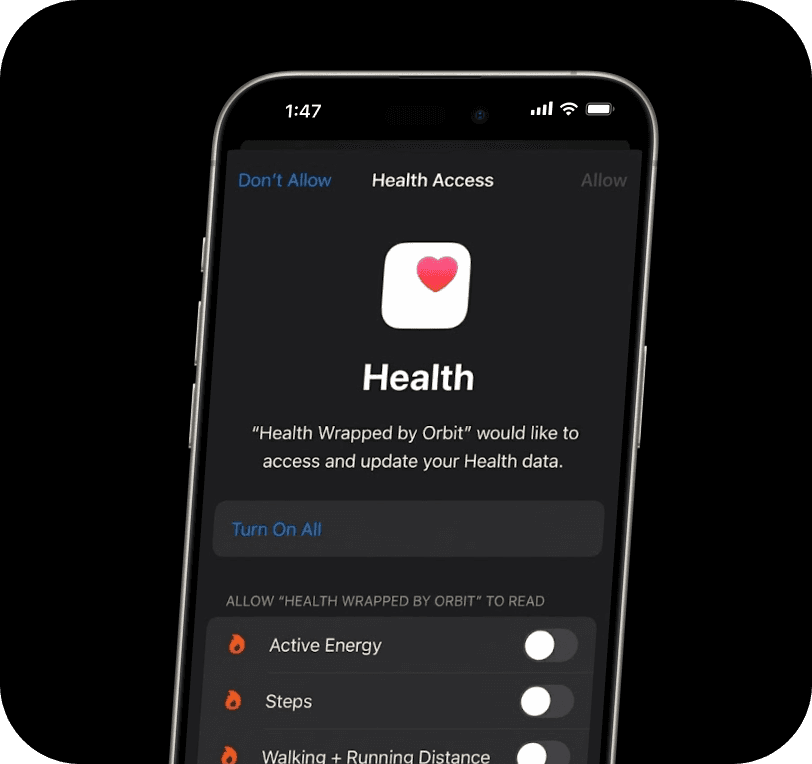
Step 2
Allow access to Apple Health
Step 2
Allow access to Apple Health

Step 3
Visualise your health journey
Step 3
Visualise your health journey
See how you've progressed in 2025.
From body movements to yearly milestones, see it all in one place.
Your Year at a Glance
Your total steps, distance, calories, and active hours — all in one view.
Your Year at a Glance
Your total steps, distance, calories, and active hours — all in one view.
Activity Trends
See how your movement changed month by month across the year.
Activity Trends
See how your movement changed month by month across the year.
Peak Moments
Discover your most active day and most active month of 2025.
Peak Moments
Discover your most active day and most active month of 2025.
Visual Heatmap
A visual heatmap of every active day across 2025.
Visual Heatmap
A visual heatmap of every active day across 2025.
Your Fitness Personality
Consistency Streaks
Your longest streaks and most consistent fitness habits.
Your Fitness Personality
Consistency Streaks
Your longest streaks and most consistent fitness habits.
2025 Apple Health Wrapped
2025 Apple Health Wrapped
Your Health Data, Finally Visualized.
We turn your Apple Health data into a simple yearly overview. Visualise your activities and share it with the world.
Watch video
Watch video
How Health Wrapped works
Step 1
Download iOS Mobile App
Step 1
Download iOS Mobile App
Step 2
Allow access to Apple Health
Step 2
Allow access to Apple Health
Step 3
Visualise your health journey
Step 3
Visualise your health journey
See how you've progressed in 2025.
From body movements to yearly milestones, see it all in one place.
Your Year at a Glance
Your total steps, distance, calories, and active hours — all in one view.
Your Year at a Glance
Your total steps, distance, calories, and active hours — all in one view.
Activity Trends
See how your movement changed month by month across the year.
Activity Trends
See how your movement changed month by month across the year.
Peak Moments
Discover your most active day and most active month of 2025.
Peak Moments
Discover your most active day and most active month of 2025.
Visual Heatmap
A visual heatmap of every active day across 2025.
Visual Heatmap
A visual heatmap of every active day across 2025.
Your Fitness Personality
Consistency Streaks
Your longest streaks and most consistent fitness habits.
Your Fitness Personality
Consistency Streaks
Your longest streaks and most consistent fitness habits.